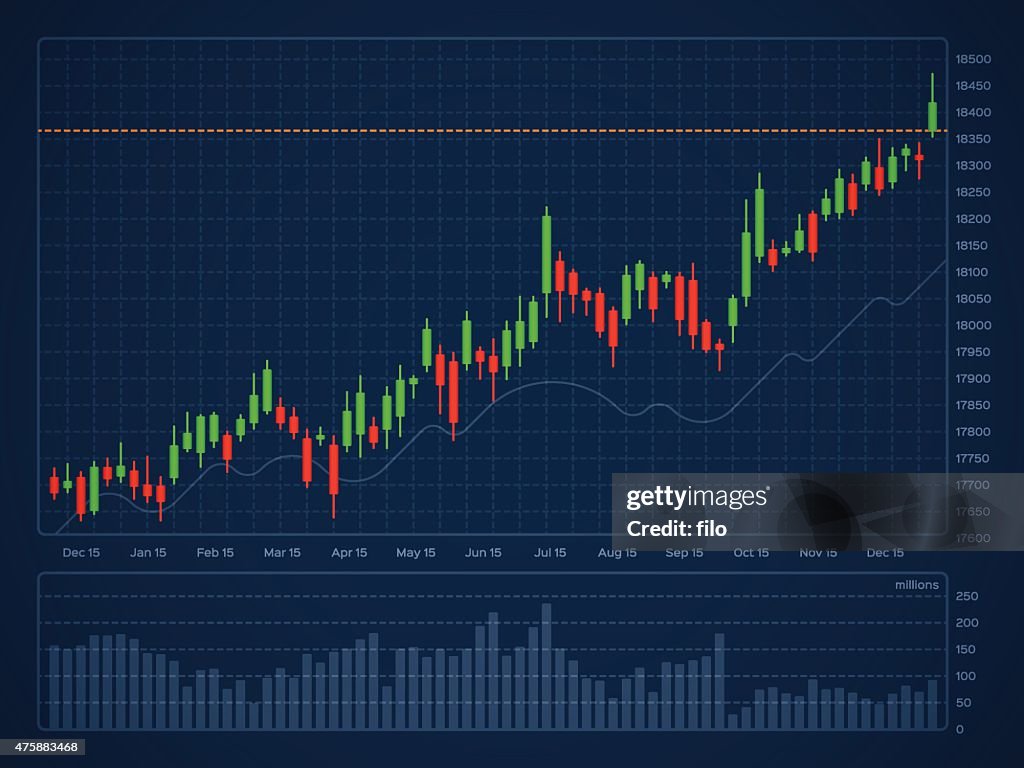
Candlestick Financial Analysis Trading Chart - stock illustration
Candlestick chart financial chart used to illustrate price movements of a security, derivative, or currency showing open, close, high price and low price for each day over a specified period of time. EPS 10 file. Transparency effects used on highlight elements.

Get this image in a variety of framing options at Photos.com.
PURCHASE A LICENSE
All Royalty-Free licenses include global use rights, comprehensive protection, simple pricing with volume discounts available
$375.00
CAD
DETAILS
Credit:
Creative #:
475883468
License type:
Collection:
DigitalVision Vectors
Max file size:
4711 x 3533 px (11.11 x 8.33 in) - 424 dpi - 3 MB
Upload date:
Release info:
No release required
Categories:
- Stock Market and Exchange,
- Chart,
- Graph,
- Candlestick Holder,
- Stock Market Data,
- Trading,
- Finance,
- Computer Graphic,
- Moving Up,
- Line Graph,
- Pattern,
- Vector,
- Growth,
- Investment,
- Savings,
- Making Money,
- Currency Exchange,
- Exchanging,
- Global,
- Global Business,
- Data,
- Analyzing,
- Business,
- Diagram,
- Exchange Rate,
- Retail Display,
- 2015,
- Banking,
- Bar Graph,
- Buying,
- Currency,
- Financial Item,
- Illustration,
- Progress,
- Selling,
- Success,
- Wealth,